One of the best way that we can make business marketing decisions is to analyze and evaluate the performance of our marketing efforts. When I am looking at websites the big questions that I like to find the answer for, are:
- How did someone find out about you?
- What are they looking for?
- Did they find what they were looking for?
- What trends are developing?
- What Keywords are they searching for?
My go to tools for this are Google’s Analytics and Webmaster Tools. With these tools, we are able to answer the above questions and make the marketing decision that will help move us forward and toward a more profitable year.
How can we use these tools to better organize the massive amounts of data that is gathered? How can we optimize the results and show only the data that we want to see. And how can we see trends in the data that will help us to make the desisions we need to make for when is the best time to make an offer or have the big annual sale.
 Tips and Tricks for Google Analytics
If you have spent any time looking at Google Analytics, you know that there is almost more information than you want, unless you are a statistician and lots of data is your thing. Thankfully, Google has provided us a way to customize and display that information in custom reports that make our monitoring our websites traffic much easier. These custom reports are called Dashboards and provide all the customization that we need to show just the analytical information for a web team or even a department manager.
Here are a couple of Dashboards that you can add to your account and tweet them to your specific needs. These can be added to your existing Google Analytics account.
NOTE: You will need to be logged into your Google account prior to clicking on these links.
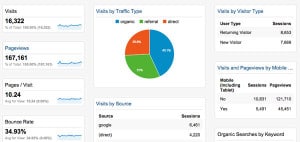
General Dashboard By NosalCentral – This is a general dashboard that will allow you to see general site statistics. Makes for a nice visual weekly report for you or a client.
Trends Dashboard By NosalCentral – This dashboard gives you a more focused view of trends on the website that you are reporting for. Gives you a view of when your visitors are coming to your site.
Filtering Google Analytics Data
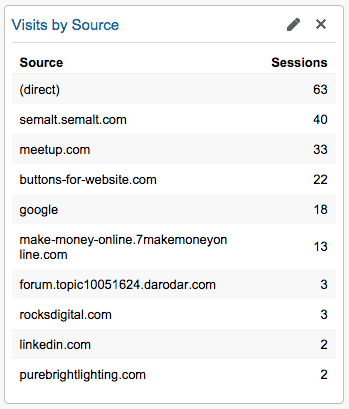 On occasion you may have a need to remove some information from the data that you are showing in a widget. A common thing that I’ll filter out of the Visits by Source widget is the non relevant referrals like SEMALT and buttons-for-websites. This gets filtered out in this case so that there is room for more relevant sites like the social media sites.
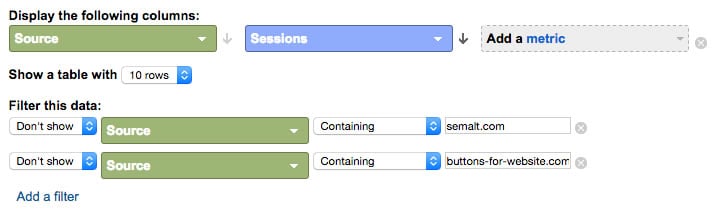
To setup a filter for removing a specific site from a widget is straight forward:
1) In the top right corner of a widget click the pencil edit button.
2) We will then add a filter using the example as seen below.
Note that you could also setup a “Show” filter to show just the pages in a specific path on your site. For example, if you had your pages on your site in specific paths based on departments. You could generate a report that shows the top 10 pages for a given department.
Long Term Analytics Tracking
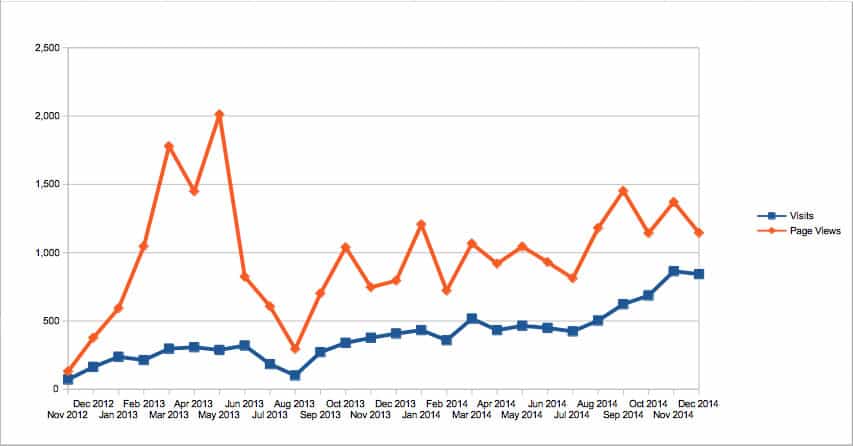
Looking at a specific slice of the analytics data is great we may want to look at performance on an annual basis. This will allow us to get an idea of the effectiveness of our SEO efforts, or a specific campaigns throughout the year.
To do this I will take monthly snapshots of the analytics and add them to a spread sheet which then allows me to review the data in a form that most clients will understand. I also have the data shown in both raw data and in various line charts to get a visual understanding of the data.
Download the NosalCentral Template – Web Stats for this spreadsheet to start tracking your 2014 and 2015 website traffic.
Website Analytics Conclusion
Tracking our website visitors allows us to better understand who they are, how they arrived and the subject of their visit. With the Dashboard feature in Google Analytics, we can customize our reporting and provide the details that we need.
If you have questions about this and other aspects of Internet Marketing or SEO, please feel free to contact me.